This strategy is a 3 step process to increase chances of profit but before I show the steps, by looking at the Dominance of the USDT usually has the opposite effect of the Crypto Market. So in order to improve results, there is a three step process.
- Apply the Rainbow Strategy or Ghost Market Pro SWING Indicators
- Look at the path of the USDT Dominance
- Look at charts for the Crypto Market
Apply The Rainbow Strategy or Ghost Market Pro SWING
The Rainbow Strategy was the first strategy I learned about which is a combination of a few moving averages (20,25,30,35,40,45,50 and 55).
You can set this up with the indicator “3 Smoothed Moving Averages” and you will need to load it 3 times. The disadvantage of using the “3 Smoothed Moving Averages” is the moving averages won’t be color coded which is visually better when making trades.
You can use “CM EMA Trend Bars” and input each seperately but you will need 8 indicators loaded. So an upgrade to TradingView will be required for this
Ghost Market Pro Indicators.
An alternative to this would be to use the “Ghost Market Pro SWING” indicator. Ghost Market Pro is a paid indicator but well worth it in my opinion.
Click Here To Access Ghost Market Pro Indicator
The Ghost Market Pro indicator has a lot of helpful indicators but the ones that stands out is the SWING indicator.
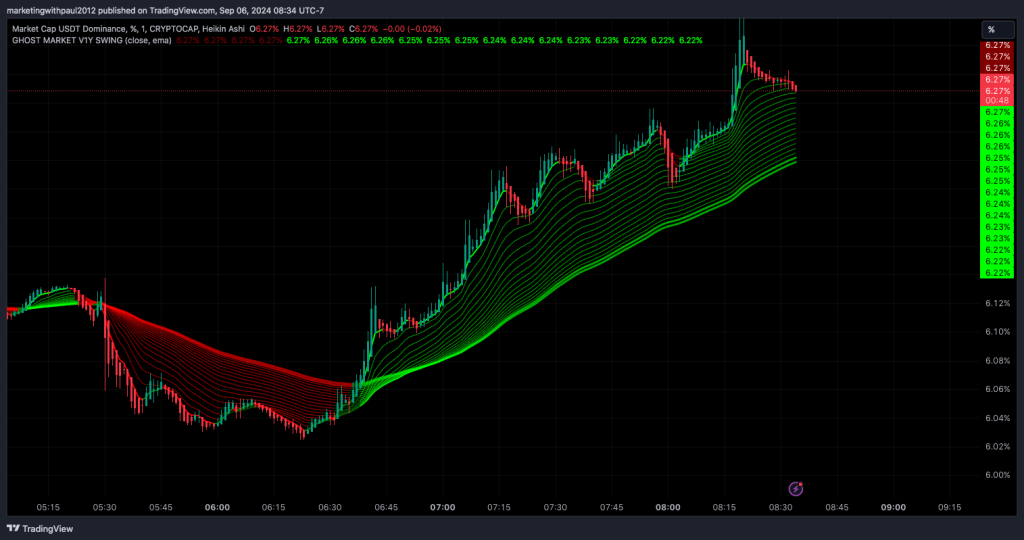
The reason why I like Ghost Market Pro is because of the SWING Indicator. The Swing Indicator has all the moving averages from “The Rainbow Strategy” but has more moving averages. The SWING contains extra indicators of 5,10,15, and 60,65,70,75,80,85,90 and 95.
You have more moving averages, so you will be able to see the path a lot clearer. So let’s apply this strategy to trading and look at the USDT Dominance
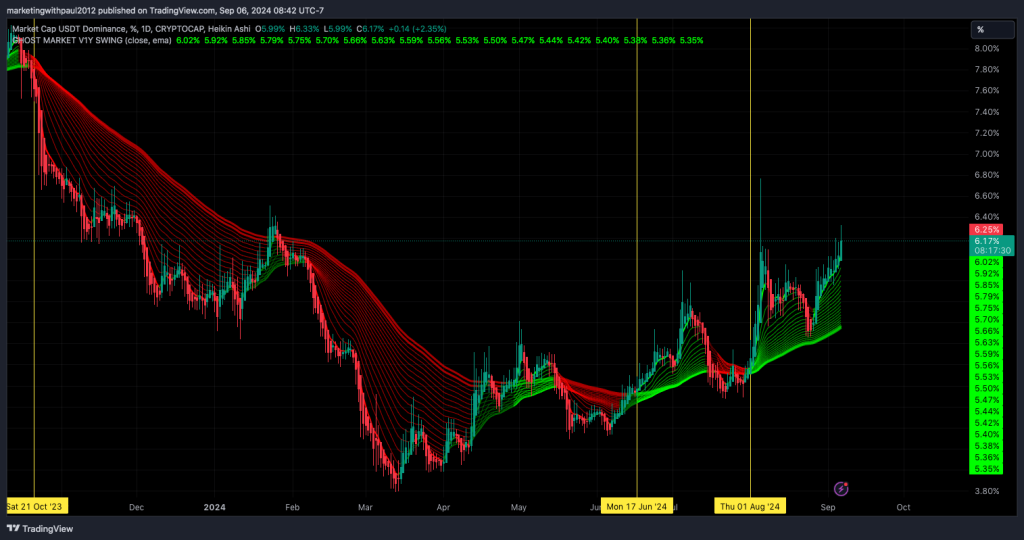
For example purposes, I have pointed out 3 days in the USDT Dominance chart on the daily chart. Those days are August 1st 2024,June 17th 2024 and October 21 2024.
Take a look at those days and you can tell by looking at the USDT Dominance, that was when there was a shift in direction.
What I am going to do now, its load up the Bitcoin chart on these exact times and see if there is a match.
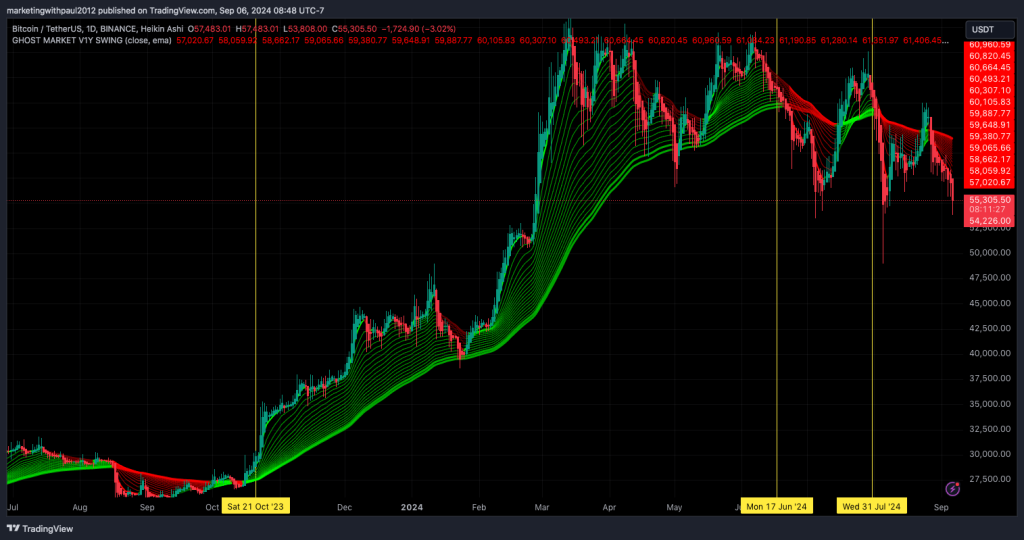
If you notice on the exact dates from the USDT Dominance, the dates most of the time do the complete opposite from each other. So basically when the USDT Dominance is Green, you want to SELL and when the USDT Dominance is Red, you want to BUY.
Do other timeframes work?
From the data, it works the best when you see a shift in direction. Longer timeframes will probably result in better results but it work for smaller timeframes as well.
Conclusion
In addition to using either the “Rainbow Strategy” or the Ghost Market Pro Swing to get the best results. Also having another confirmation indicator is recommended such as “Relative Strength Index”, “MACD” or “Andean Oscillator”